|
Asia-Pacific Forum on Science Learning and Teaching, Volume 15, Issue 2, Article 10 (Dec., 2014) |
Findings of this study were presented based on the analysis using descriptive statistics and inferential statistics such as paired samples t-test and one way ANCOVA for each research question:
Research Question 1: Is there any difference in treatment group students’ achievement between the pre-test and post achievement test after learning Cell Division topic with realistic simulation?
Paired sample t-test was used to answer the first research question. Results of the paired sample t-test showed that there was a significant difference in treatment group students’ achievement between the pre-test and post achievement test. Table II shows the results of paired sample t-test for treatment group students taught with realistic simulation.
Table II. Results of paired samples t-test for treatment group
n
M
SD
t
df
*Sig. (2-tailed)
Realistic Simulation
Pre test
68
9.32
1.86
-19.74
67
.000
Post achievement test
68
12.60
1.90
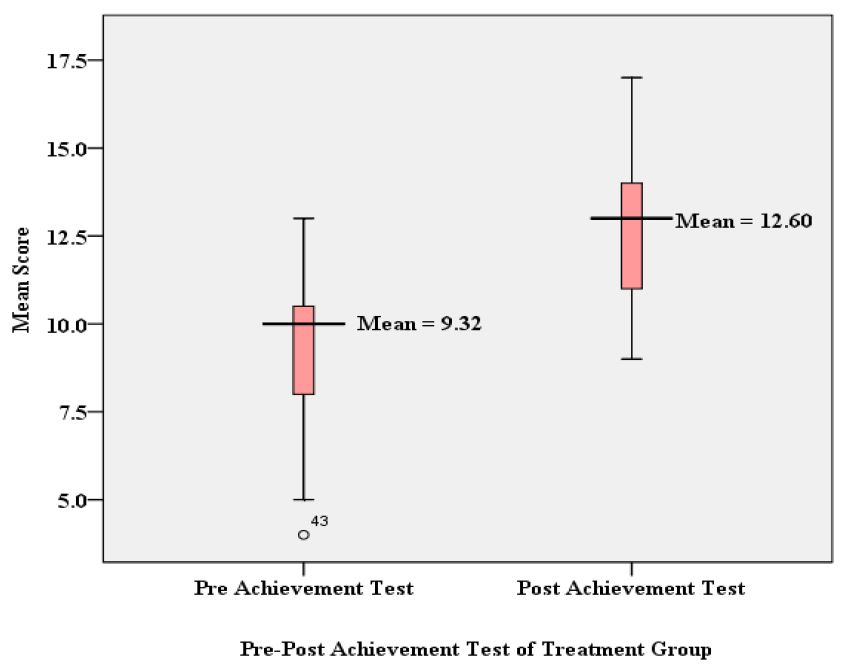
Table II shows that the treatment group students who learnt with realistic simulation had significantly higher mean scores in the post achievement test (M = 12.60, SD = 1.89) than the pre-test scores (M = 9:32, SD = 1.86), t(67) = -19.74; p <.001 (two-tailed). Figure 3 also showed the results of descriptive statistics for the treatment group students who learnt Cell Division topic with realistic simulation. The descriptive statistic results showed that the mean scores of the treatment group students have increased by 3.28 in the post achievement test as compared to the pre-test. The mean score differences between the pre-test and the post achievement test of treatment group students is presented in the Figure 3. Both descriptive and inferential statistics results show that the realistic simulation had improved the students’ understanding, performance and their achievement in Biology.
Figure 3. Difference in treatment group students’ achievement between pre test and post achievement test.
Research Question 2: Is there any difference between the pre-test and post achievement test scores of the control group students after learning Cell Division topic with non-realistic simulation?
Inferential statistics such as paired samples t-test was used to test the second research question. Results of the paired sample t-test showed that there was a significant difference in the control group students’ achievement for Cell Division topic between the pre-test and post achievement test. Results of the paired sample t-test for the group of students who learnt with non-realistic simulation is presented in Table III.
Table III. Results of paired samples t-test for control group
n
M
SD
t
df
*Sig. (2-tailed)
Non-Realistic Simulation
Pre test
68
8.09
1.92
-12.65
67 .00
Post achievement test
68
10.79
1.85
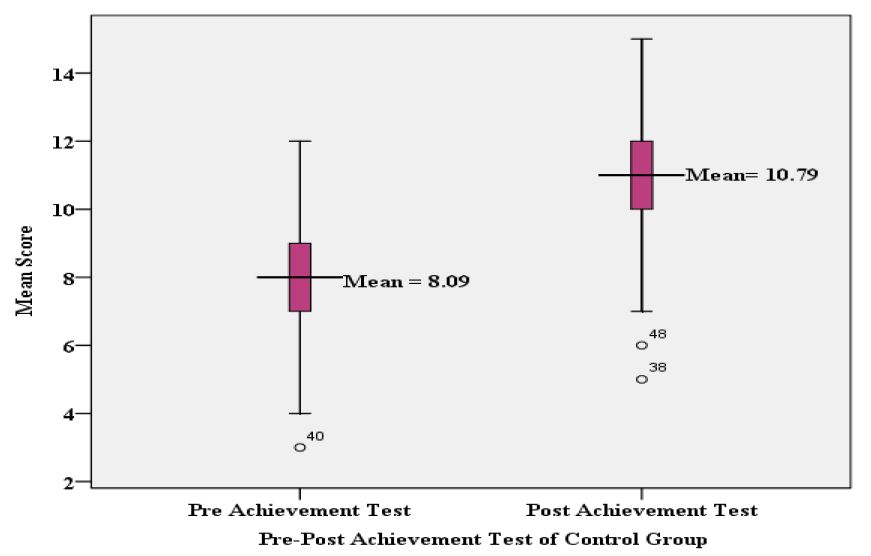
Table III shows that the control group students who learnt Cell Division topic using non-realistic simulation had significantly higher mean scores in the post achievement test (M = 10.79, SD = 1.85) than the pre-test (M = 8.09, SD = 1.92), t(67 ) = -12.15; p < .001 (two-tailed). The descriptive statistics also showed that the control group students’ mean scores have increased by 2.70 in the post achievement test as compared to the pre-test. Mean scores differences between pre test and post achievement test of control group is presented in Figure 4. Both descriptive statistics and inferential statistics results indicate that non-realistic simulation based teaching method had improvesd students’ understanding, performance and their achievement.
Figure 4. Difference in control group students’ achievement between pre achievement test and post achievement test.
Research Question 3: Are there any differences in the post achievement test scores between the treatment group students who learnt with realistic simulation and control group students who learnt with non-realistic simulation?
The third research question was analyzed with inferential statistics such as one way analysis of covariance (ANCOVA). One way ANCOVA method was used to compare the effectiveness of realistic simulations with non-realistic simulations on students’ post achievement test scores. Basic assumptions underlying one way ANCOVA such as homogeneity of variances, homogeneity of regression slopes and linearity were checked before running the main analysis of one way ANCOVA. Findings of preliminary analyses showed that these basic assumptions for analysis of covariance (ANCOVA) are not violated and can therefore proceed with ANCOVA analysis.
The pre-test was used as a covariate to control the effects of covariate (pre-test) on the dependent variable (students’ post achievement scores). The results of the main analysis (test between subject effects on students’ post achievement scores) are shown in Table IV after controlling the effects of covariates (pre-test scores).
Table IV. Tests of between-subjects effects for dependent variable: post achievement test scores
Source
Type III sum of squares
df
Mean square
F
Sig.
Corrected model
Intercept296.851a
2
148.426
69.561
.000
237.534
1
237.534
111.323
.000
Pre test (Covariate)
185.609
1
185.609
86.987
.000
Groups
33.134
1
33.134
15.529
.000
Error
283.788
133
2.134
Total
19193.000
136
Corrected total
580.640
135
a. R squared = .511 (Adjusted R squared = .504)
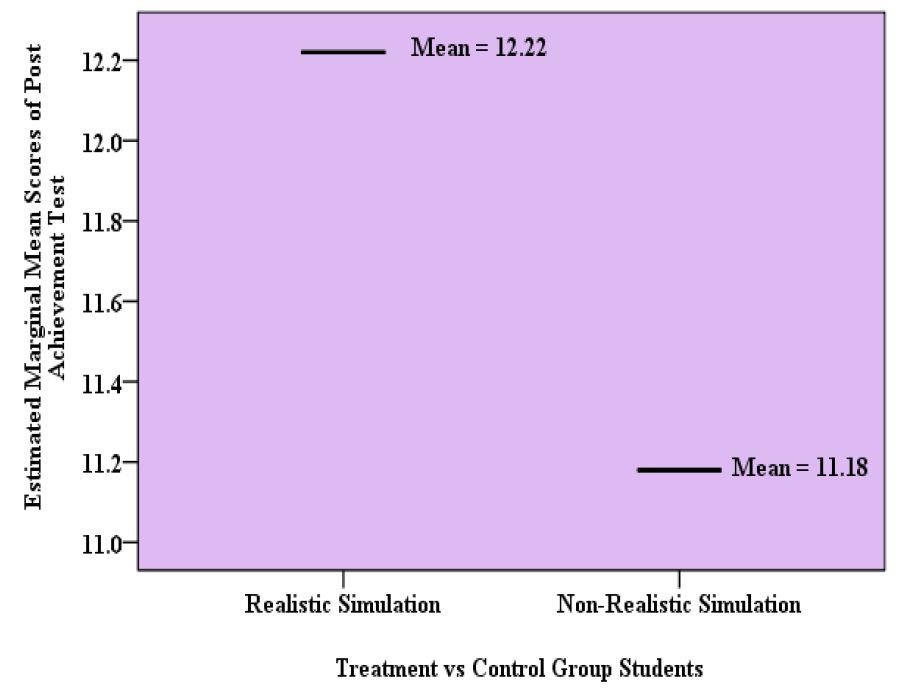
The results (F(1, 133) = 15.529; p = .00) showed that there is a significant difference in post achievement test scores between control group and treatment group students after adjusting the effects of pre test scores (Table IV). Furthermore, the estimated marginal means (adjusted mean which is controlling for the effects of covariate) for the post achievement test also showed that the treatment group students (M = 12.22) had improved significantly by 1.04 more than the control group students (M= 11.18). The estimated marginal means for dependent variable: post achievement test scores is shown in Table V and Figure 5.
Table V. Estimated marginal means for dependent variable: post achievement test scores
a. Covariates appearing in the model are evaluated at the following values: post achievement test scores
Groups
Mean
Std. Error
95% confidence interval
Lower bound
Upper bound
Realistic simulation
12.218a
.182
11.858
12.578
Non-Realistic simulation
11.179a
.182
10.819
11.539
Figure 5. Difference in estimated marginal mean scores for post achievement test between control group and treatment group students.
These results indicate that realistic simulation based teaching method is more effective for learning Cell Division topic in Biology than the non-realistic simulation. Realistic simulation is shown to improve students’ performance and achievement for the Cell Division topic.
Research Question 4: Is there any difference in the memory retention between treatment group students and control group students for Cell Division topic?
One way analysis of covariance (ANCOVA) method was used to compare the effectiveness of realistic simulations with non-realistic simulations on students’ post memory retention. The basic assumptions underlying one way analysis of covariance (ANCOVA) such as homogeneity of variances, homogeneity of regression slopes and linearity assumptions were tested before conducting the ANCOVA. Findings of preliminary analysis showed that the basic assumptions for one way analysis of covariance (ANCOVA) were met and therefore can proceed with one way ANCOVA.
The pre-test was used as a covariate to control the effects of covariate (pre-test) on the dependent variable (students’ post memory retention). The results of the main analysis (test between subject effects on students’ post memory retention) are shown in Table VI after controlling the effects of covariates (pre-test scores).
Table VI. Tests of between-subjects effects for dependent variable: post memory retention test scores
Source
Type III sum of squares
df
Mean square
F
Sig.
Corrected model
Intercept322.537a
2
161.268
62.884
.000
121.604
1
121.604
47.418
.000
Pre test (Covariate)
182.507
1
182.507
71.166
.000
Groups
49.192
1
49.192
19.182
.000
Error
341.081
133
2.565
Total
13906.000
136
Corrected total
663.618
135
a. R squared = .486 (Adjusted R squared = .478)
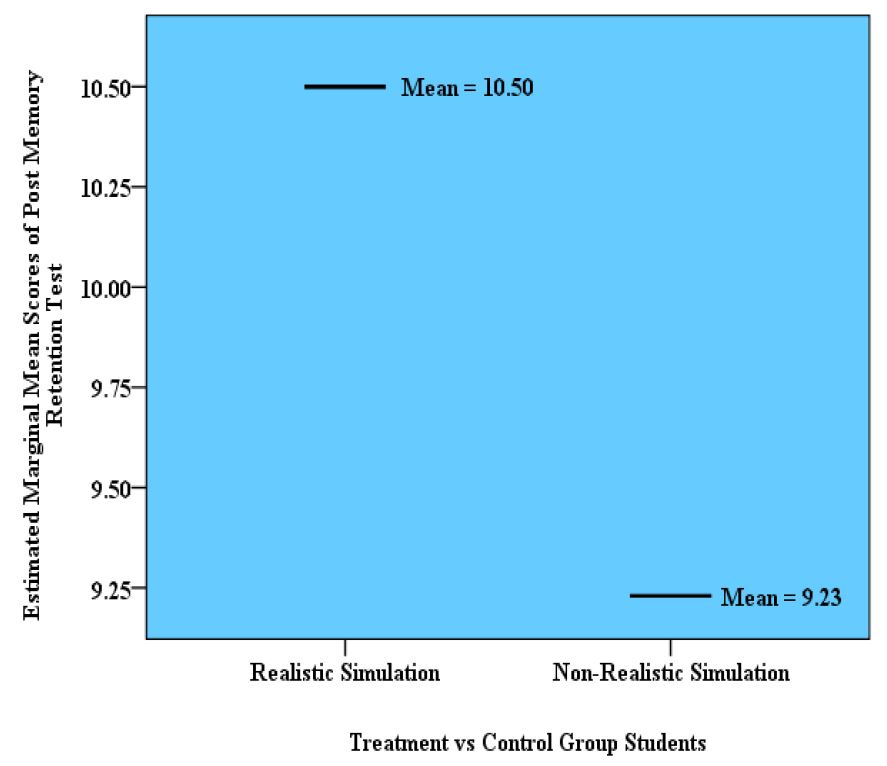
The findings showed that there is a significant difference in students’ post memory retention test scores between control group and treatment group after controlling the effects of pre test scores (F(1, 133) = 19.182; p =.00). Furthermore, the estimated marginal means (adjusted mean which is controlling for the effects of covariate) scores for the post memory retention test also showed that the treatment group students (M = 10.50) had gained significantly by 1.27 more than the control group students (M= 9.23). The estimated marginal means for dependent variable: post memory retention test scores is shown in Table VII and Figure 6.
Table VII. Estimated marginal means for dependent variable: post memory retention test scores
a. Covariates appearing in the model are evaluated at the following values: post memory retention test scores = 8.71.
Groups
Mean
Std. Error
95% confidence interval
Lower bound
Upper bound
Realistic simulation
10.501a
.199
10.106
10.895
Non-Realistic simulation
9.234a
.199
8.840
9.629
Figure 6. Difference in estimated marginal mean scores for post memory retention test between control group and treatment group students.
Table VII and Figure 7 showed that the realistic simulation is an effective teaching method for learning Cell Division topic in Biology compared to the non-realistic simulation. Teaching and learning that uses realistic simulation enhanced students’ understanding and improved F(1, 133) = 19.182their memory retention for Cell Division topic.