|
Asia-Pacific Forum on Science Learning and Teaching, Volume 15, Issue 2, Article 10 (Dec., 2014) |
A sample of 136 Form Four Biology students were divided into two groups: experimental/treatment group (68 students) and the control group (68 students). Two Form four Biology classes were randomly selected from two different secondary schools of Perak, Malaysia. Two Biology classes from the first school were assigned as treatment group while the other two Biology classes from the second school were assigned the control group.
Teaching and learning in experimental and control groups
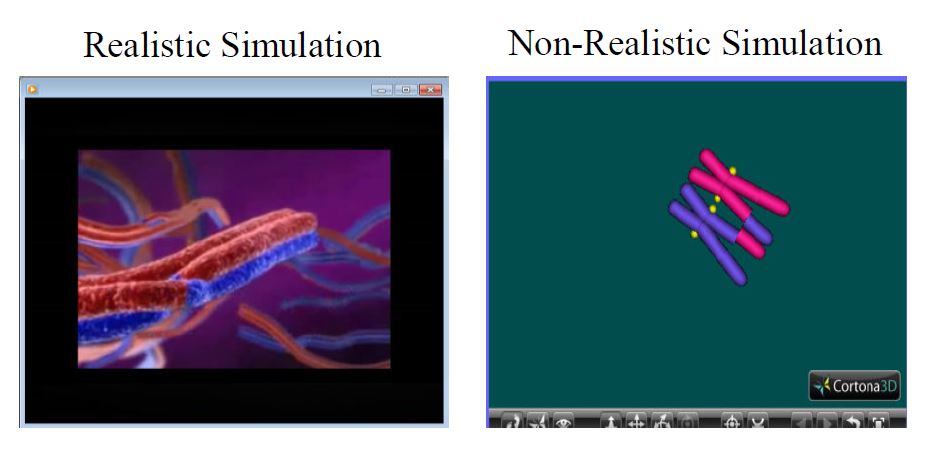
The control group was taught Cell Division topic using non-realistic simulation while the treatment group was taught using realistic simulation for three weeks. Realistic simulation (3D multimedia simulation) and non-realistic simulation (3D desktop virtual reality simulation) were chosen from existing and freely accessible computer simulation software from the website. Both realistic and non-realistic simulations consisted of four main concepts on Cell Division: Cell Cycle, Mitosis, Meiosis I and Meiosis II. Snapshots of realistic simulation and non-realistic simulations are shown in Figure 1:
Figure 1. Snapshot of realistic and non-realistic simulation for meiosis concept.
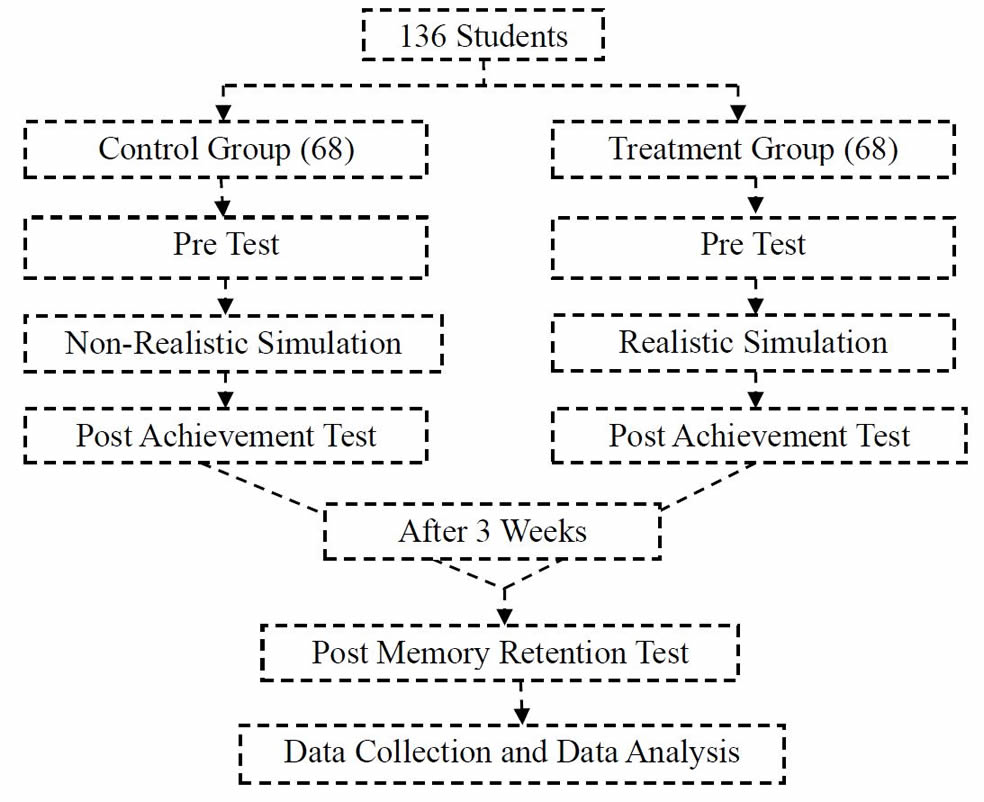
The pre-test was given to students of both control and treatment groups before they were taught the topic of Cell Division with realistic simulation and non-realistic simulation. The post achievement test was given immediately to both control group and treatment group students on the third week after they finished three weeks of learning using realistic simulation and non-realistic simulations. Post memory retention test was given on the sixth week, that is, three weeks later after the post achievement test. The framework of teaching and learning process involved in this study is summarized in Figure 2:
Figure 2. The framework of teaching and learning process.
Measurement was carried out through a set of pre-test and post-test (post achievement test and post memory retention test). Both pre-test and post-test consisted of 18 objective questions regarding Cell Division based on the Form Four Biology Syllabus. Both pre-test and post memory retention test were validated by experienced Biology teachers and modified based on the comments and suggestions given.
A pilot study was conducted to determine the validity and reliability of the research instruments (post achievement test and post memory retention questions). Both post achievement test and post memory retention test were administered to 61 Form Four Biology students who were not involved in the research. The students were given 20 minutes to complete each test. The post achievement test was given on day one while the post memory retention test was given on the following day.
Reliability is defined as the consistency of the measurement (Hartas, 2010). The reliability of the post achievement test and post memory retention test was determined using the Kuder-Richardson Formula 20 (K-R 20) method. The index of discrimination (ID) and the difficulty index (CI) were also determined for both the post achievement test and post memory retention test. Analysis of the pilot study showed that the post achievement test yielded a reliability coefficient of 0.57 while the post memory retention test yielded a reliability coefficient of 0.65. This result shows that the post memory retention test is reliable and accepted. The reliability coefficient of the post achievement test, 0.57 is lesser than the suggested cutoff value of 0.60. However, the post achievement test is still valid, reliable and acceptable since the value obtained was close to the suggested reliability coefficient of 0.60 (Gliner & Morgan, 2000; Lyles, 2008; Menard, 2008).
This study was a quasi-experimental study using a quantitative approach and involves measurement and variables such as the dependent and independent variable. The dependent variable for this study is the Biology students’ achievement and memory retention while, the independent variable is the 3D computer simulation based teaching and learning method (realistic simulation and non-realistic simulation). Measurement is carried out through a set research instruments.
Descriptive statistics and inferential statistics such as paired samples t-test and one way ANCOVA were used to analyzed the data in this study. The significance level was set at the suggested p <0.05 for inferential statistics such as paired samples t-test and one way ANCOVA. Results obtained are reliable by 95% if the p value is less than .05. Table I shows the type of analysis that was used to answer each research questions in this study.
Table I. Summary of scientific methods used for analysis
No
Research Questions
Scientific Methods
1
Is there any difference in treatment group students’ achievement between the pre-test and post achievement test after learning Cell Division topic with realistic simulation?
Paired Samples t-test
2
Is there any difference between the pre-test and post achievement test scores of the control group students after learning Cell Division topic with non-realistic simulation?
Paired Samples t-test
3
Are there any differences in the post achievement test scores between the treatment group students who learnt with realistic simulation and control group students who learnt with non-realistic simulation?
One Way ANCOVA
4
Is there any difference in the memory retention between treatment group students and control group students for Cell Division topic?
One Way ANCOVA
Preliminary check such as normality of the distribution of data in each scale have been checked to ensure that the basic assumptions for parametric tests such as paired samples t-test and one way ANCOVA method were not violated. The basic assumptions of one way ANCOVA method such as the linearity, homogeneity of regression slopes and homogeneity of variances were also checked before running the one way ANCOVA analysis. Pre-test and post-test (post achievement test and post memory retention test) data were analyzed using SPSS 16.0 software.