|
Asia-Pacific Forum on Science Learning and Teaching, Volume 19, Issue 1, Article 10 (Jun., 2018) |
The most difficult and easiest type of chemical representation is answered by the students in the experiment group
Based on the results of the above analysis, of the 27 questions given the most difficult questions answered by students in the experiment group are No. 24 and 23. Problem No. 24 only successfully answered by 5 students while the No. 23 successfully answered by 7 students. Both of the two questions are questions that have a kind of mathematical representation. The type of problem is as follows
- Item No. 24
In a space of 5 L at a certain temperature, there is equilibrium
2SO3(g) ↔ 2SO2(g) + O2(g). If 160 grams of SO3 (Ar S = 32, O = 16) is heated to that temperature until equilibrium is reached, and the mole ratio of SO3: O2 = 4: 2 then the equilibrium constant of the reaction is ...
- Item No. 23
Into a 10 L volume container, 8 mol of NH3 is introduced so that the reaction occurs: 2NH3 (g) ↔ N2 (g) + 3H2 (g). If in equilibrium state there are 4 mol of NH3, then the Kc price for the equilibrium reaction is ...
While the most easily answered questions by students in the experiment group are questions No. 3, 10, 16, and 26. Problem No. 10 is a symbolic representation, while No. 3, 16, and 26 are symbolic and macroscopic representations.
The type of representation most difficult and most easily answered by students in the control group
Based on the results of the analysis, of the 27 questions given, there are 3 questions that are considered the most difficult by students that are the No. 7, 8 and 22. The three questions above include submicroscopic and mathematical representations. Type of question is as follows
- Item No. 7
If at a temperature of 270C, the price of Kc = 1.6 x 10⁻² Kp price is ...
- Item No. 8
At a certain temperature, in space, 1L HI gas is introduced and decomposes according to the equilibrium reaction of 2HI (g) ↔H2 (g) + I2 (g). If the equilibrium state of H2 is equal to HI mol, then the degree of dissociation HI is…
- Item No. 22
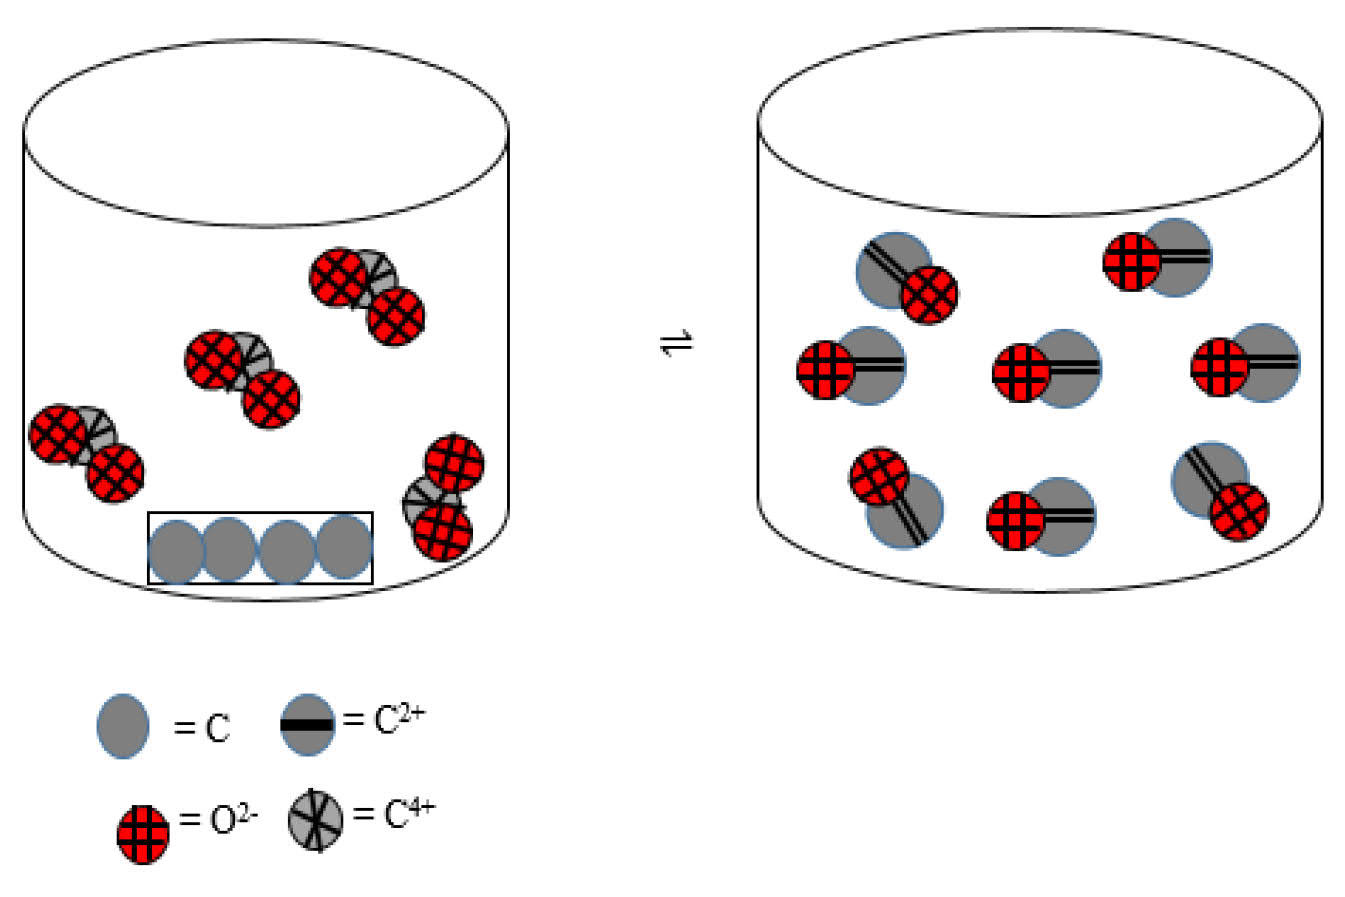
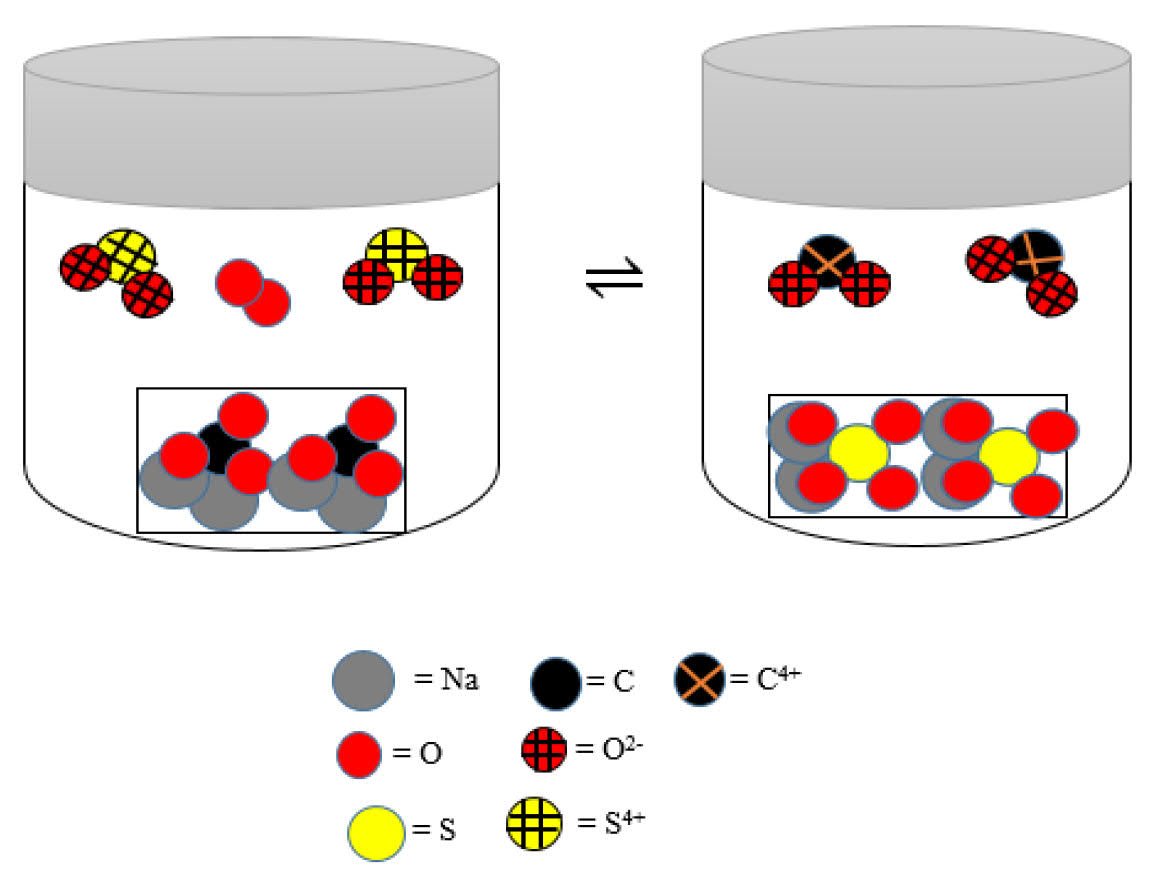
Consider the mechanism of equilibrium reaction at the following submicroscopic level
The equilibrium constant (Kc) of the reaction is ...The most easily answered questions by students are questions of No. 1 and 10 that contain a type of symbolic representation.
Prior to the parametric statistical analysis, a preliminary analysis is necessary to perform the data normality test and homogeneity test of each sample.
- Normality Test
Normality test results data between experiment and control groups can be seen in Table 4.
Table 4. Normality test results
Class Sig. Kolmogorov Smirnoff Conclusion Experiment Normal Control Normal Based on the above table it can be seen that the significance value of the calculation results in each class is greater than the significance value α = 0.05. Thus the data comes from normally distributed populations and meets the assumptions for performing statistical parametric tests.
- Homogeneity Test
Homogeneity test used in this research is Levene test. Homogeneity test used to know the homogeneity of variance for each class. Homogeneity test in this research using test result data on previous material that is reaction rate. Testing criterion is experiment class variance and control group is homogeneous if value significance > 0,05 whereas if significance value <0,05 then stated data distribution is not homogeneous. The results of the analysis can be seen in the Table 5
Table 5. Homogeneity test results
Group Conclusion Experiment and control Homogenous From the table above can be seen that the value of significance obtained by 0.682 greater than the significance value α = 0.05. Thus this data is homogeneous and meets the assumptions for parametric statistical tests.
Based on the normality and homogeneity test which states that the data is normalized and homogeneous, then it is continued with the hypothesis test. Hypothesis test in this research using independent sample t-test. The test was performed to determine whether there were differences in the mean of two unpaired samples. The results of the independent sample t-test test shows that there is a significant difference in the students' cognitive learning outcomes between experiment group with a control group on chemical equilibrium. The value of significance (2-tailed) produced is 0.000 < 0.05.