Asia-Pacific Forum on Science Learning and Teaching, Volume 19, Issue 1, Article 15 (Jun., 2018) |
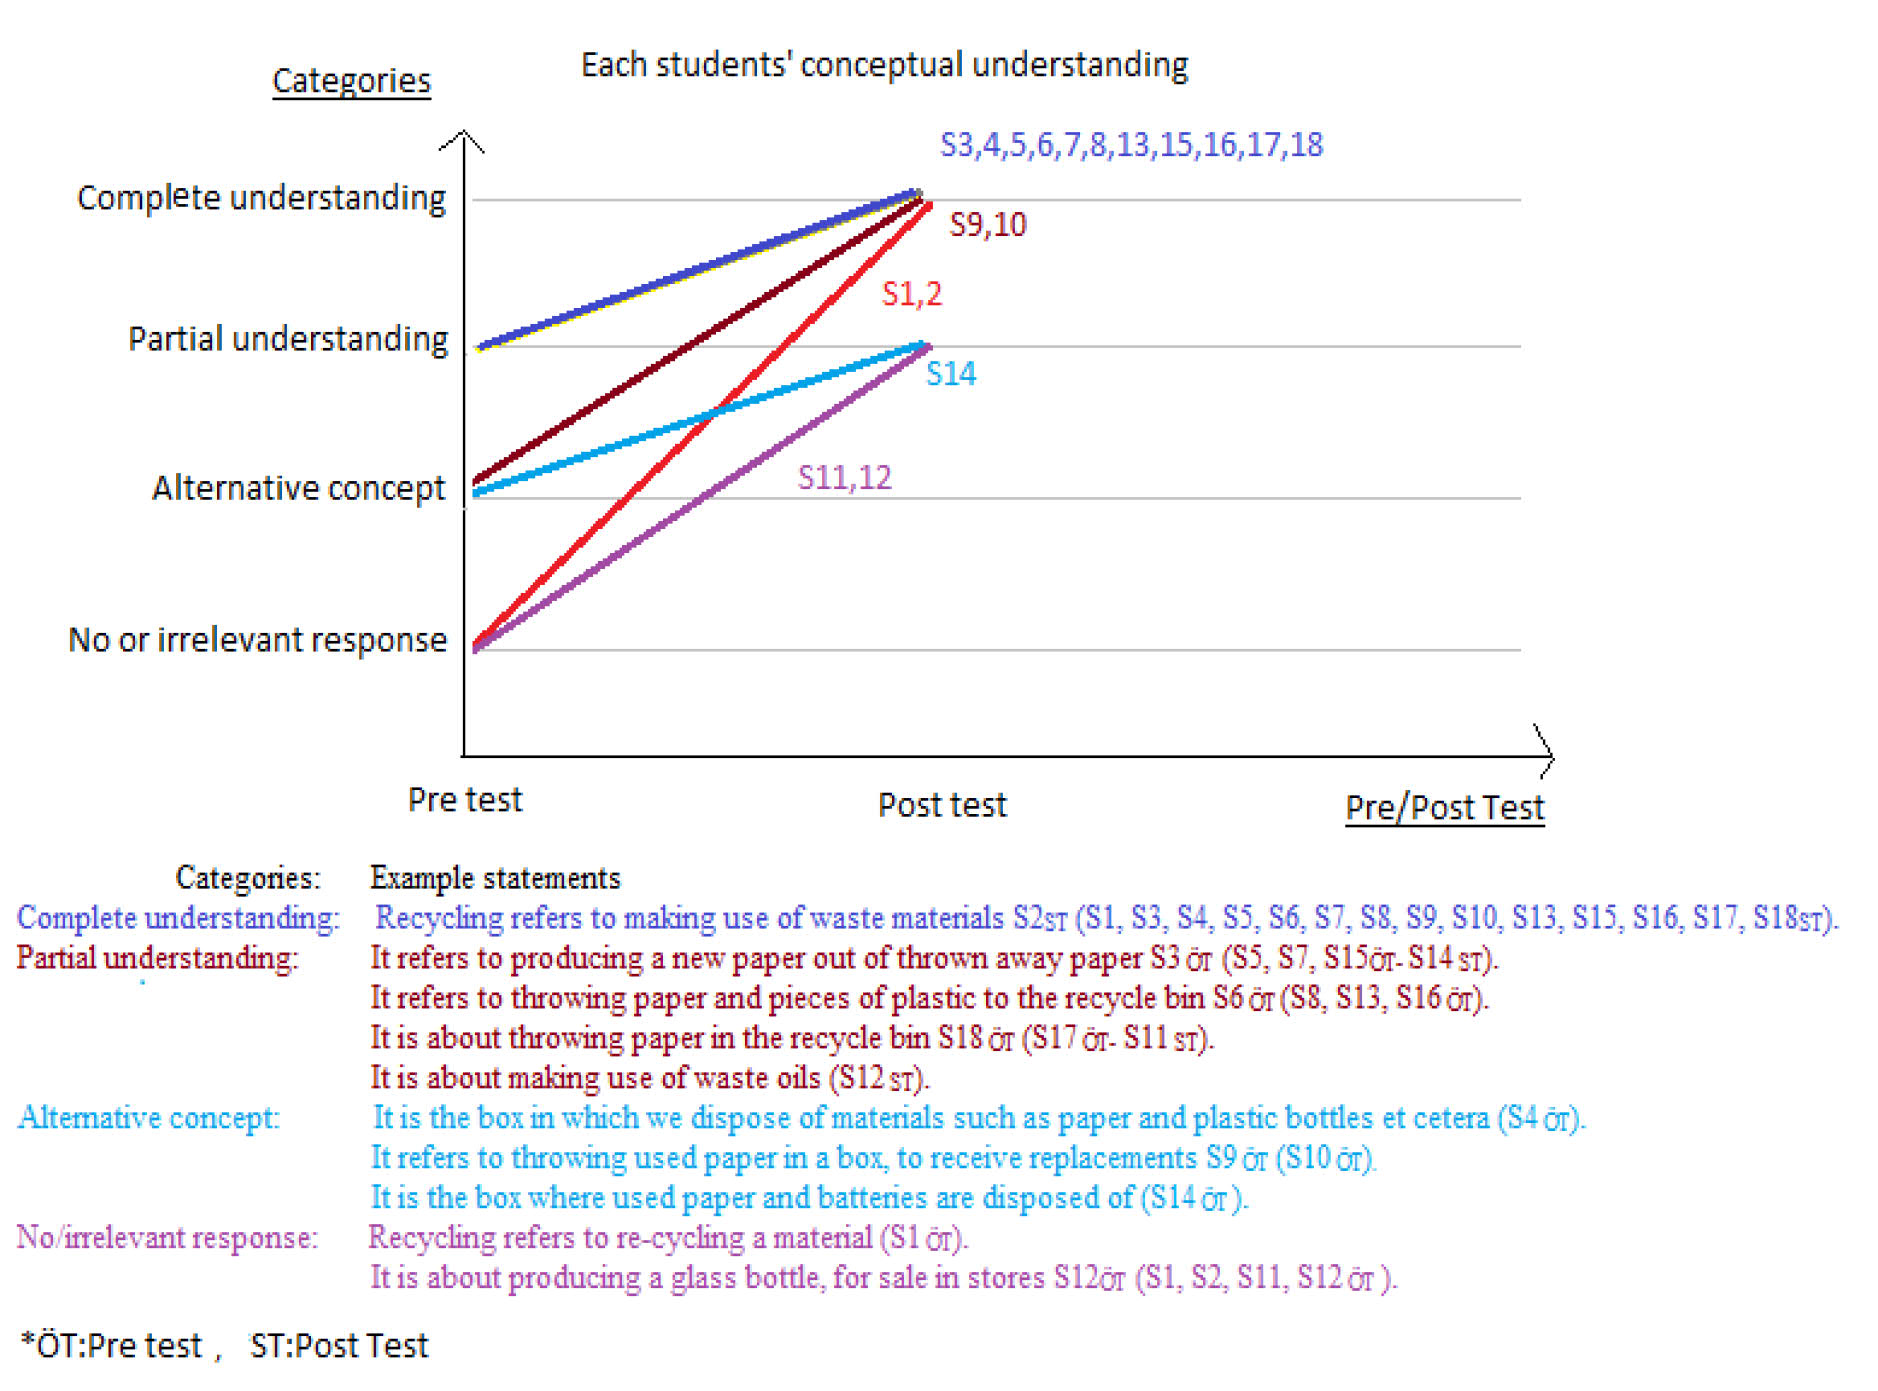
Each students' conceptual understanding related to the 1st question in the concept test can be seen in figure 5.
Figure V. Each Students' Conceptual UnderstandingWhen Figure 5 is examined, it is observed that S3,4,5,6,7,8,13,15,16,17,18 students were in the partial understanding category in the pretest. The students' conceptual understanding increased to the complete understanding category in the post test. The review of the responses provided by the students to the first question of the test revealed that the large majority of the students failed to provide a thorough definition of the concept of recycling. As Figure 5 reveals, the overwhelming majority of the students referred to the production of recycled paper out of waste paper. Furthermore, the pre-test revealed that 4 students provided unrelated definitions. The drawings provided by the students in response to the 2nd question in the concept test have been presented in Figure 6. Some students drew more than one code.
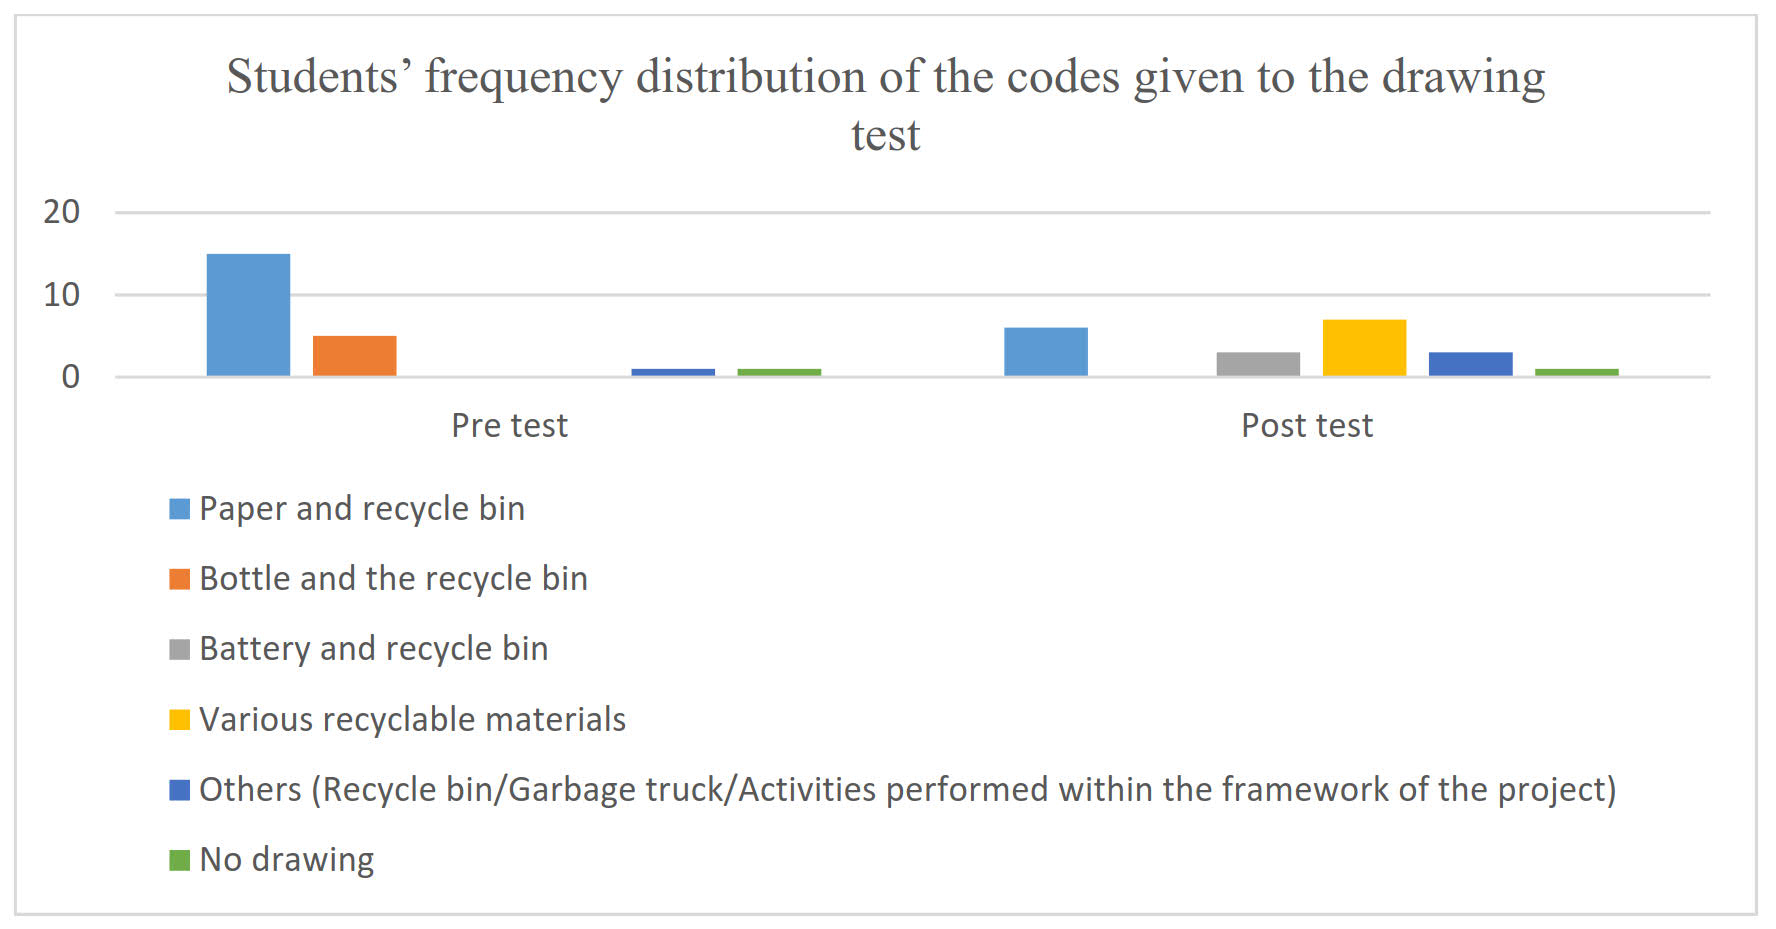
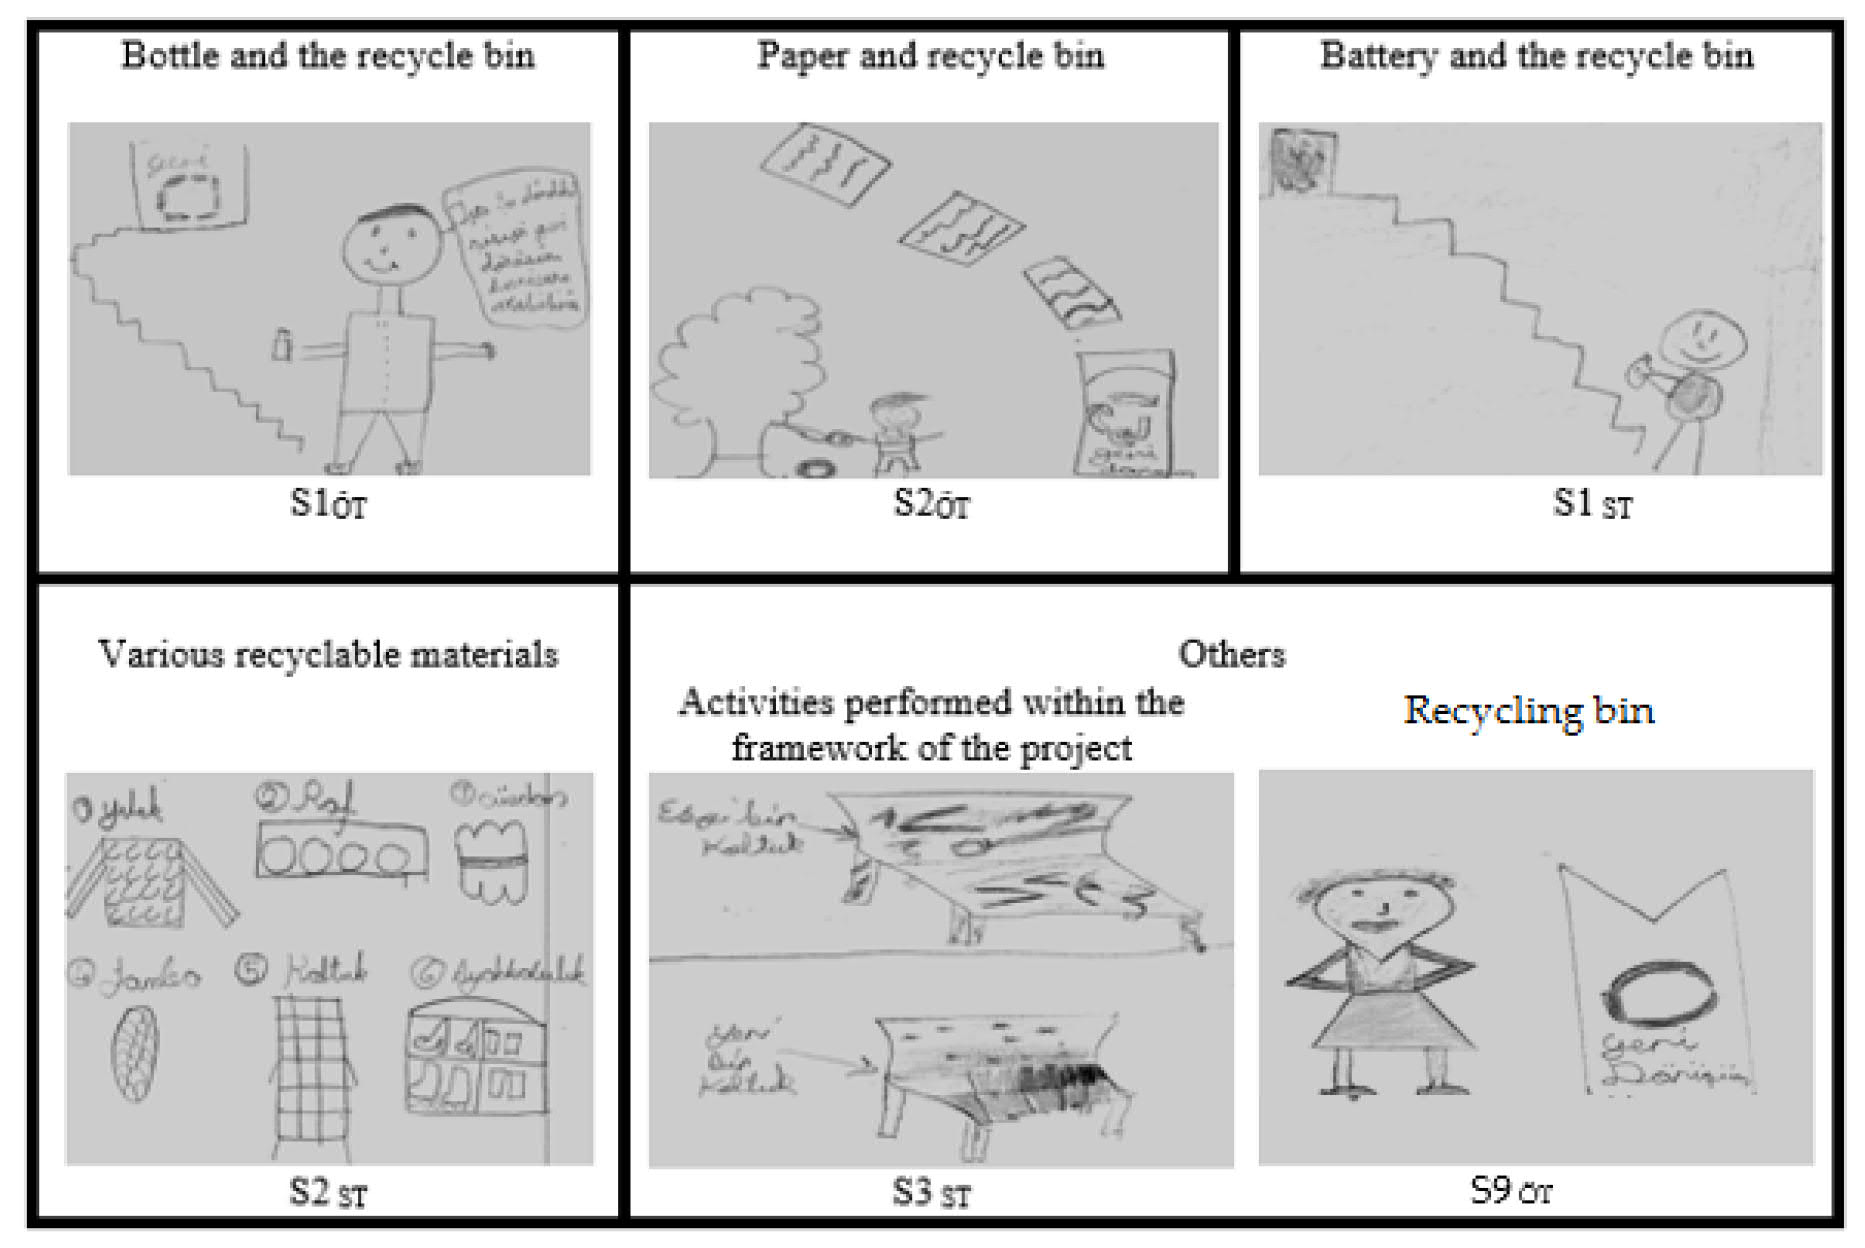
Figure VI. Students' Frequency Distribution of the Codes Given to the Drawing TestA glance at Figure 6 reveals that the drawings by the students can be categorized under the groups "bottle and the recycle bin", "paper and recycle bin", "battery and recycle bin", "various recyclable materials", "others" and "no drawing". Figure 6 shows that the vast majority of the students provided drawings in the paper and the recycle bin category in the pre-test concerning the recycling concept. The post-test, on the other hand, saw 6 of the students reflect various recyclable materials in their drawings. The examples of the drawings provided by the students in each category, with respect to the concept of recycling, are provided in Figure 7.
Figure VII. Samples of the Students' DrawingsWhen Figure 7 is examined, it is observed that students have different drawings. Students S3ST drew his/her project named "a new armchair project". The findings regarding the concept of recycling, reached through the interviews, are presented in Figure 8.
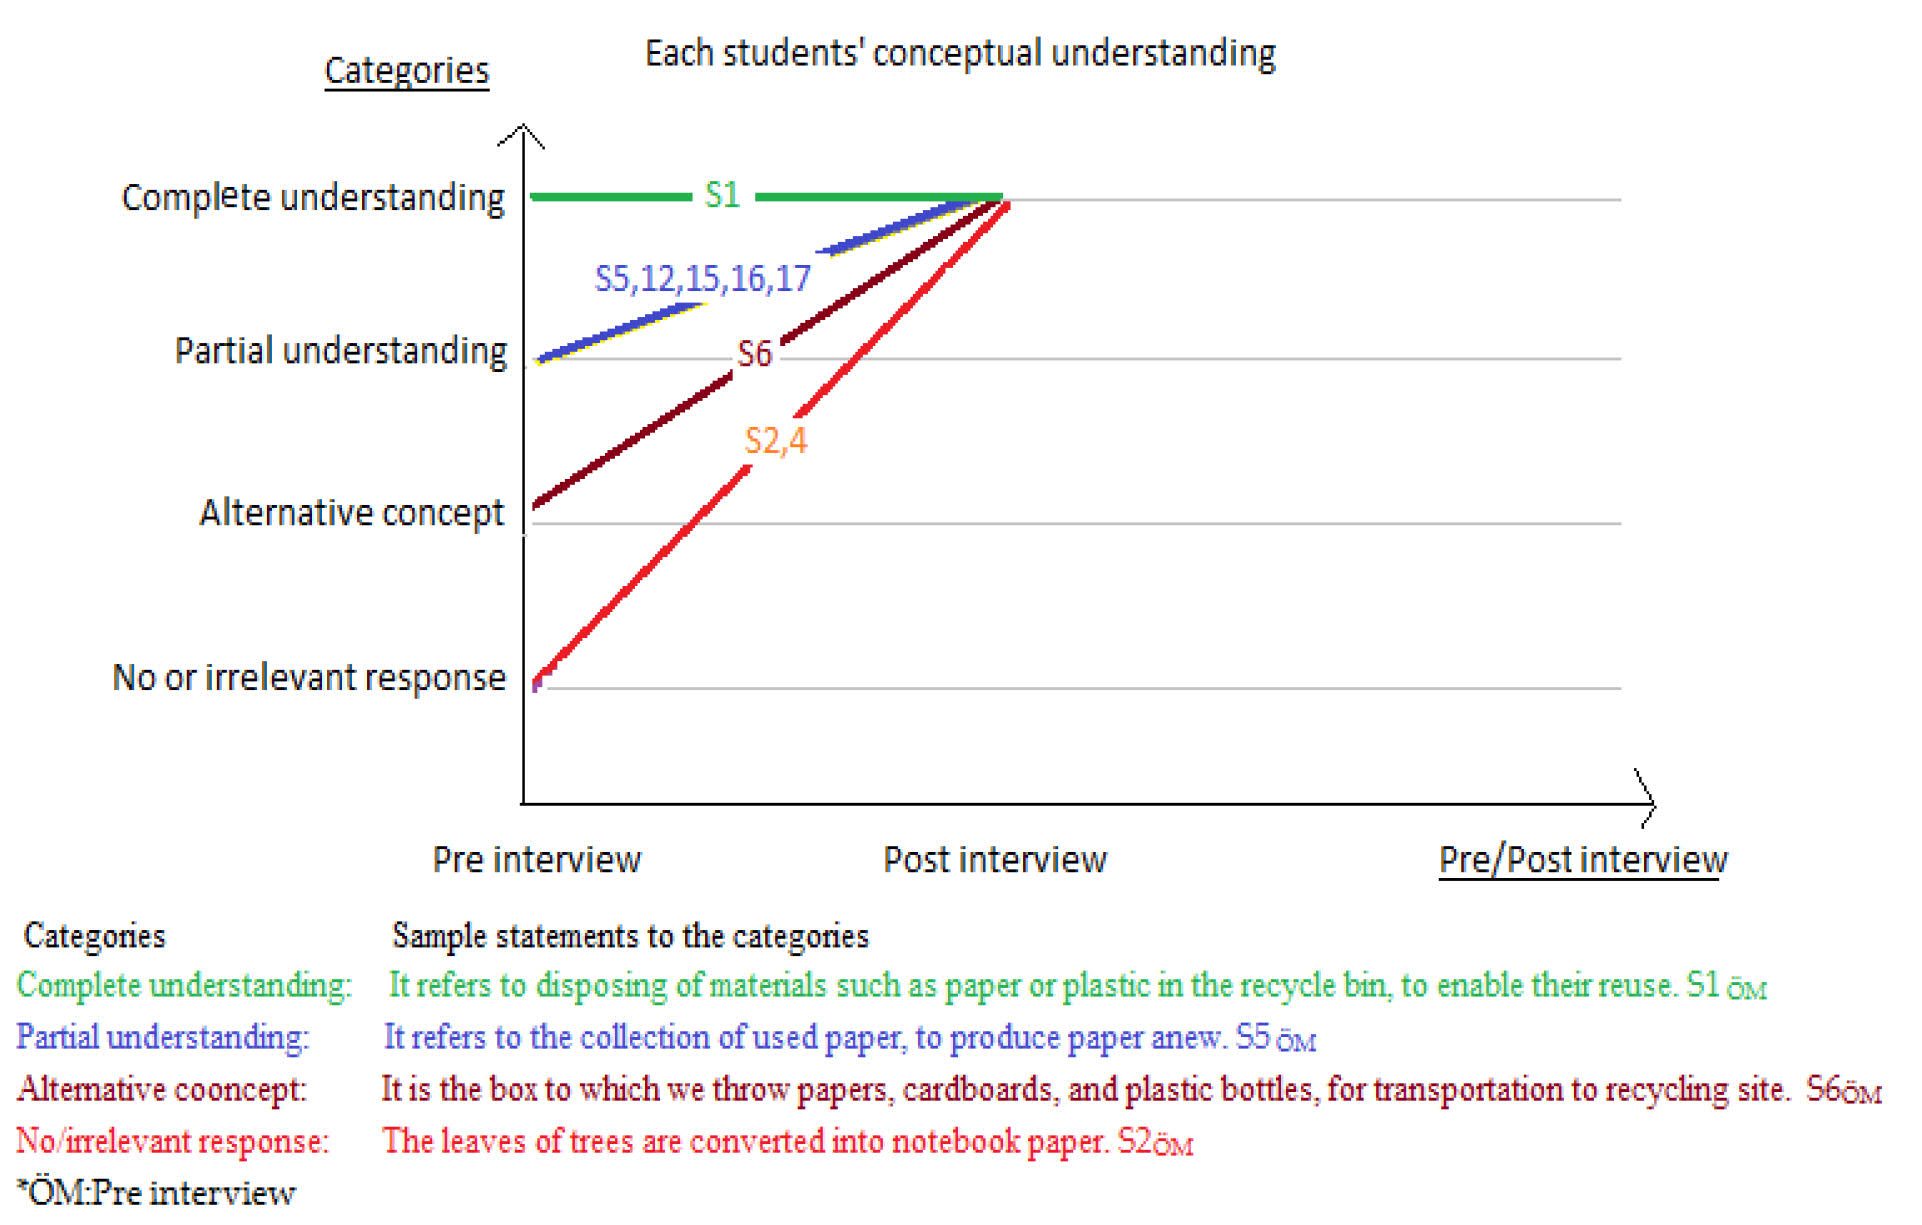
Figure VIII. Categorization of the Responses to the Interview Question, and Selected StatementsThe review of the responses provided by the students to the interview questions reveals that the vast majority of the students provided responses which can be categorized under the partial understanding category. In the post-application interview, on the other hand, all the students provided responses suggesting complete understanding. No alternative conceptualizations were observed among the students during the post-application interview. The findings regarding the "Which substances may be recycled? Please explain." Question have been presented in table II.
Table II. Students' Responses and Codes
Paper Garbage Waste materials Pre interview S2, S17, S4, S5, S6, S12, S15 S16 S1 Post interview - - S2, S17, S4, S6, S12, S15, S16 As seen in Table II, the students stated paper, garbage and waste materials may be recycled. Most of the students stated that paper may be recycled in the pre-test. Dependent t-test results of the concept test pre-post test scores have been presented in Table III.
Table III. Results of the Dependent t-Test
Mean Rank
N
Std. Deviation
Sd.
t
p
Pre test
1,3889
18
,84984
17
-8,695
,000
Post test
2,8333
18
,38348
As seen in Table III, there was a significant difference in favour of the post test (t= -8,695, p<0.05).


